

Conversion Rate Optimization Case Study
How we increased conversion rates of an Ecommerce website by 7%
About The Client
Our client is a new age Ayurvedic company that strives to bring the traditional, time-tested goodness of Ayurveda to 21st century customers. With an expertise of 150 years in Ayurveda, their formulations and knowledge for Ayurvedic products have been passed down from generation to generation through dedicated practice.
After treating thousands of patients for over a century and perfecting unique blends through careful expertise, the company now owns 100+ FDA approved formulations for Ayurvedic proprietary medicine.


The Challenge
The client was spending a lot of money on online advertising, largely on Facebook and Google, to drive traffic to their Ecommerce website and generate sales, but were not able to see any significant increase in revenue.
Our Approach
We first had a macro look at their product portfolio and tried to understand their target audience in terms of demographics and needs. They had a wide range of products catering to different audience segments across multiple age groups.
We then did a deep dive in their Google Analytics to identify the user behavior across last 12 months and noticed that the new users vs. repeat users were more or less the same across all these months.
We went further to analyze the mobile vs. desktop behavior and found the following :
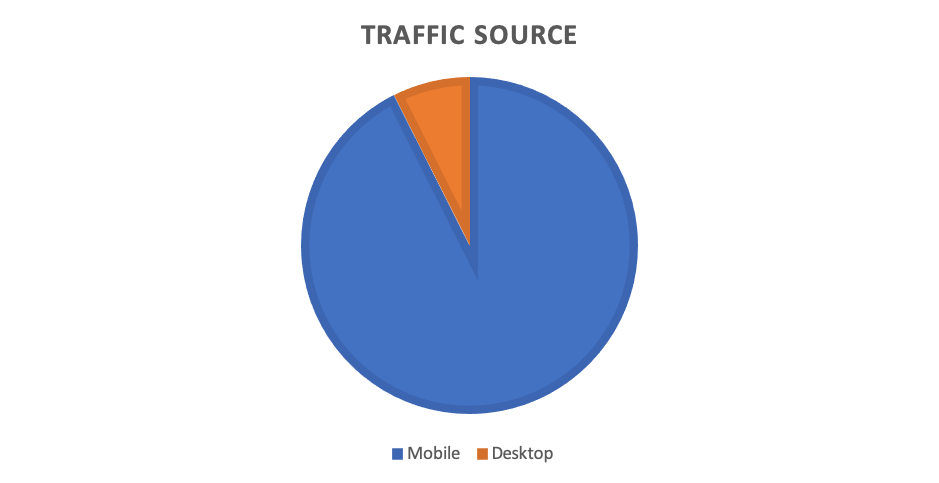

Traffic on Mobile was 13 times than of Desktop.
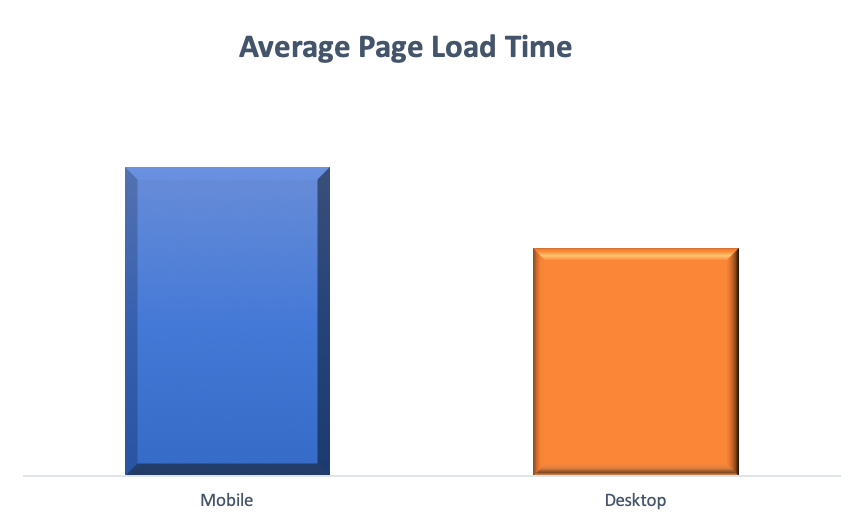

The Average Page Load Time on Mobile was 26% higher than desktop.
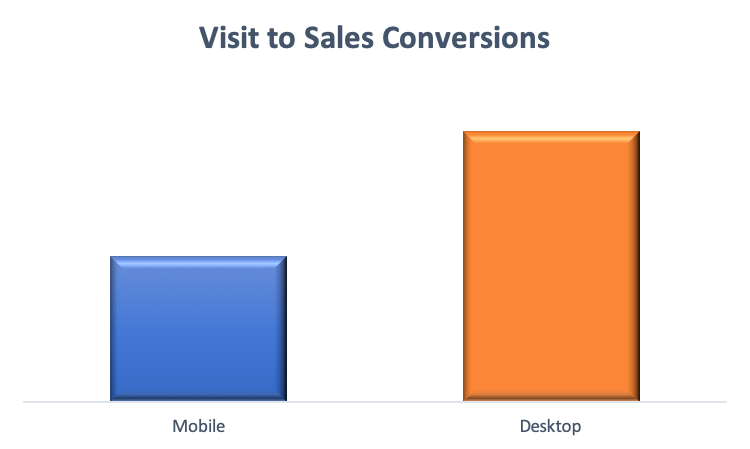

Visits to sales conversion ratio on mobile was 46% lower as compared to Desktop.
This was a clear indicator that the mobile experience had to be optimized on priority and should be the starting point for the conversion rate optimization process.
We further did a deeper analysis on mobile and found out that users using the following mobile phones had the lowest conversions :
- Samsung SM-G610F Galaxy J7 Prime
- Xiaomi Redmi 5A
- Samsung J701F Galaxy J7 Nxt
- Xiaomi Redmi 6A
The experience on Android devices was clearly an issue since conversions on IOS devices were higher than Android devices.
As a next step, we went on to study the cities from where maximum traffic was coming and their respective conversion rates and found the following data for last 6 months :
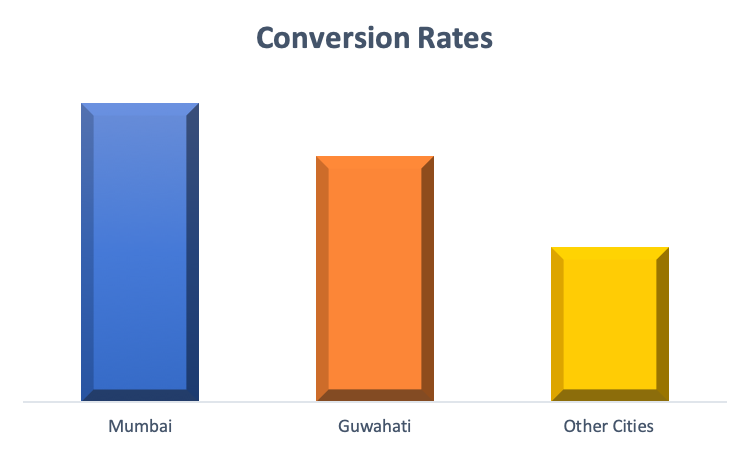
Mumbai and Guwahati had the highest conversion rates as compared to other cities. This is because the client was well established and people trusted their brand in these cities.
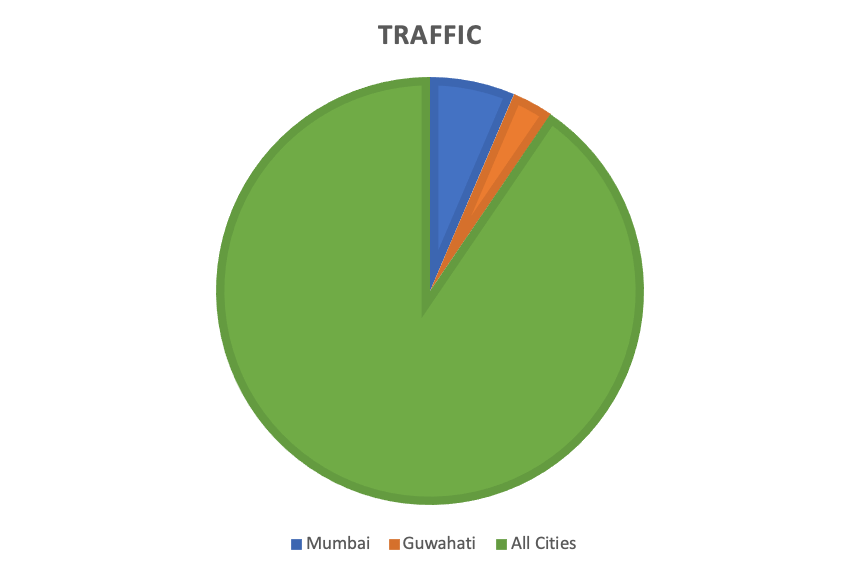

However, the traffic from these two cities was just 10% of the overall website traffic.
Thus, it was clear that the focus has to be on these two cities and we need to target our ads in these cities.
Next, we compared the conversions of two sets of users – one who use the internal site search on the site and one who buys without using the site search. We did this for Desktop and Mobile devices separately and the results were alarming.
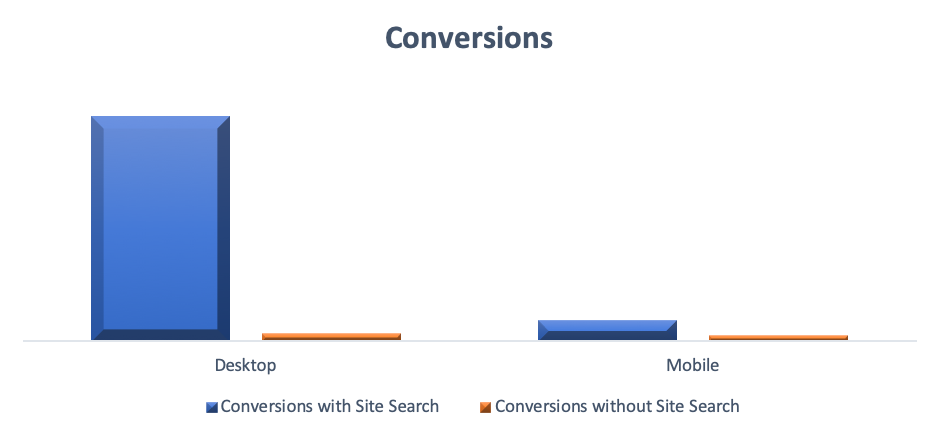

Desktop conversions were 97% higher for users who were using a site search as compared to the ones who did not use the site search.
Mobile conversions were also higher by 27% as compared to users who did not use a site search.
Thus, it was very clear that the internal site search was able to assist users and help them buy. We had to now improve the visibility of site search and try and ensure more and more users use that for their purchase.
Next, we analyzed the user behavior in terms of traffic and bounce rate on Desktop and Mobile across the top visited pages on the website.
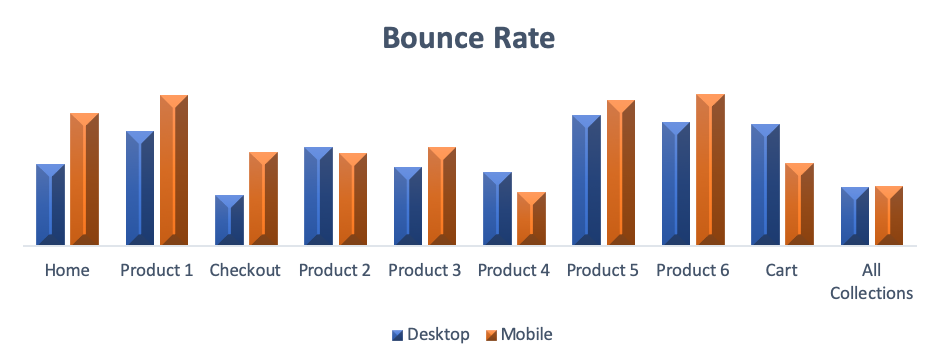

Though the results were predictable and mobile bounce rate was higher across all pages in comparison to Desktop, but we also noticed that Desktop bounce was higher than average on certain product pages.
This gave us a starting point for our CRO process.
Conversion Rate Optimization Process
After the above analysis, we were very sure that we had to improve the mobile experience since the bulk of the users were using a mobile device to access the site. So we started with the pages where the bounce rate was maximum and were getting significant amount of traffic.
We did a user experience (UX) audit on those pages using different mobile devices and analyzed the entire purchase funnel right till order placement. We identified and reported several issues that the end user would be facing while shopping on the site.
These reported issues were largely related to :
- Navigation links
- Site search
- Product page layout
- Offers popup
- Multi-lingual content pages
- Checkout
We reported 23 mobile issues and 5 desktop issues in total to the client which were fixed by the client’s tech team. We worked closely with their team to ensure all issues were fixed.
We further did A/B tests of the product page layout and site search to measure the overall impact of our recommendations.
Results
Within one month of implementing the recommended changes, the client achieved the following results :
- 7% increase in overall website Conversion Rates
- 8% increase in Revenue