

Competitive Intelligence Case Study
How we increased New Customer Acquisition by 17% for a Luxury Fashion Brand with our Competitive Intelligence Service
About The Client
Our client is an Indian luxury women’s designer wear brand and has been elevating Indian silhouettes through global dressmaking sensibilities for almost two decades.
The client had an omni channel presence and was looking forward to expand its sale globally through its own e-commerce website.

Indian Luxury Industry
The Indian Luxury Industry has been on a growth path. Growing consistently at a pace of 20-25% PA for past several years, it was projected to touch $180b by 2025.
Conspicuous consumption is likely to be replaced by conscious, responsible and sustainable luxury. Brands can no longer just skim the surface and will perhaps need to take sustainability in a more serious manner.
The Challenge
The client was investing money in paid advertising on Google and Facebook to drive sales on their e-commerce website. However, their sales numbers (in terms of orders and value) remained almost stagnant.
They were unable to scale their online sales through paid advertising and the monthly sales numbers did not improve by more than 5% much, despite of increasing advertising budgets by almost 25%.
However, the client confirmed that two of his closest competitors were driving significant sales (orders and value) from their own e-commerce websites and were also gaining significant market share on an ongoing basis.
Our Competitive Intelligence Approach
Before analyzing the user-funnel and implementing a complete conversion rate optimization strategy, we first wanted to understand the user acquisition strategy for the client as well as for his closest competitors. Considering that the brand was not targeting the masses, it was important to understand the industry dynamics first.
Thus, we started with an analysis of their closest competitors to understand how they were driving traffic and sales on their respective e-commerce websites. The objective was to identify the gaps in our client’s digital approach viz a viz their closest competitors in the online space.
Traffic Analysis (Website Visits)
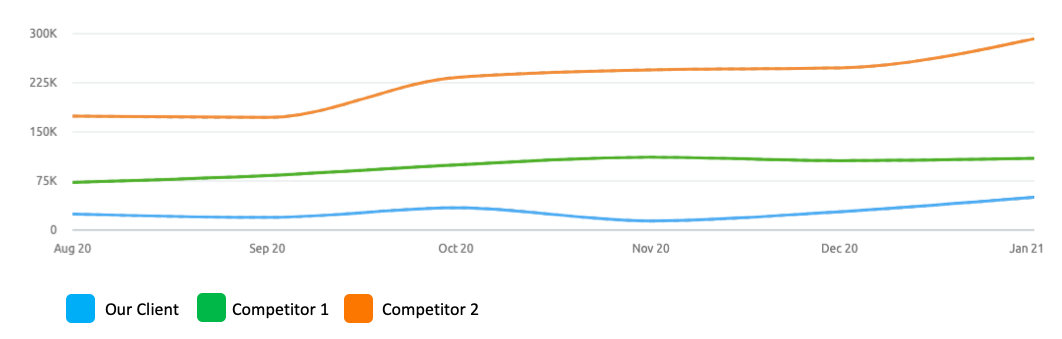

We did an analysis of our client’s website visits in comparison with his closest two competitors. We analysed the data over a 6 months period and realised that the monthly traffic/visits for our client was way below his competitors.
Unique Visitors
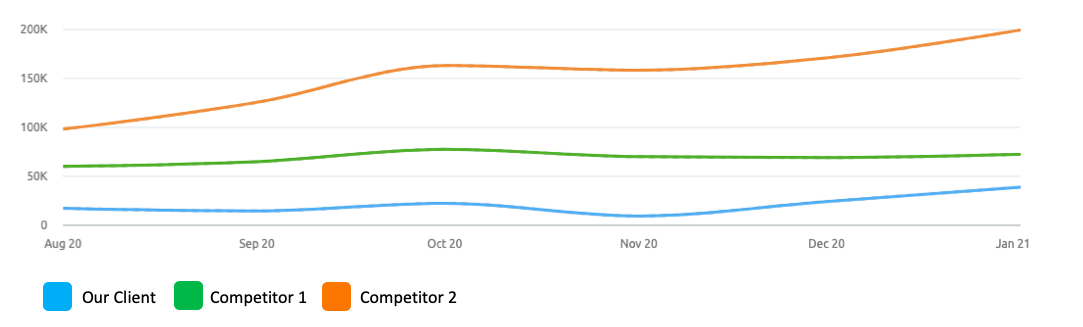

We further looked at the monthly unique visitors data over the same time period and realised that the unique visitors were also quite low for the client and showed a similar trend like that of monthly traffic.
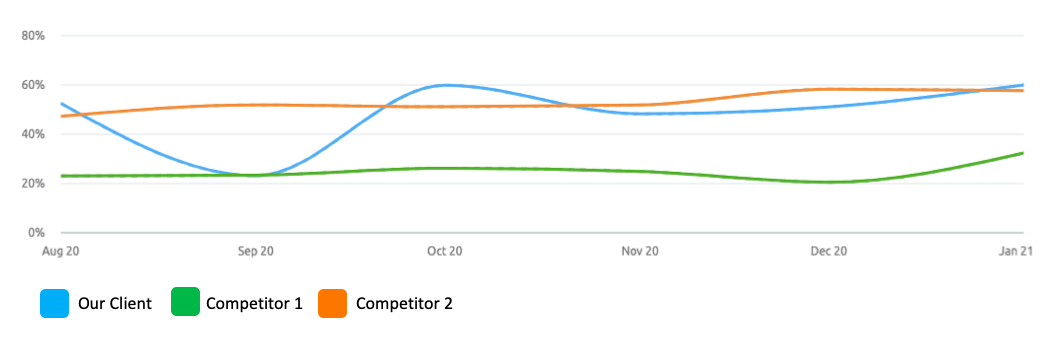
We then went ahead to analyse the average number of pages per visit and the average visit duration across these three websites to understand the user behavior.
Pages/Visits
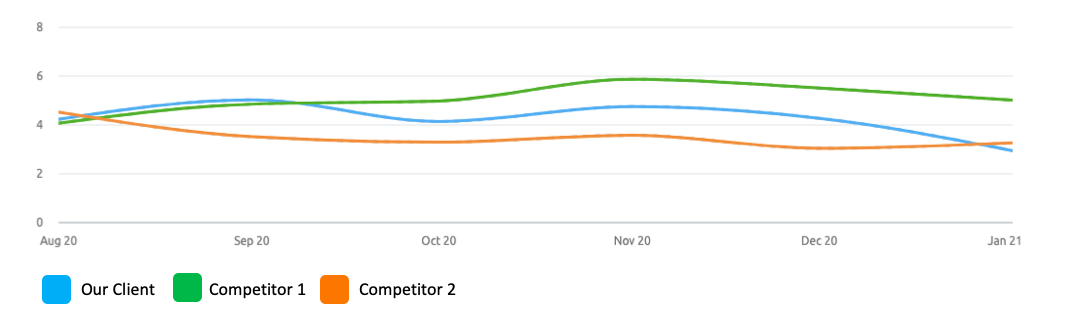

Average Visit Duration
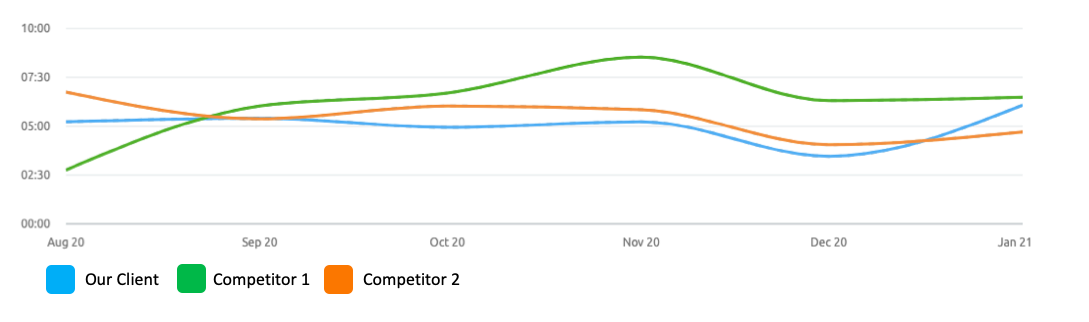

We observed that the average number of pages that a website visitor was accessing and his average duration per visit was not bad as compared to the competitors.
Bounce Rate

Although the bounce rate on our client’s website was on a higher side with respect to one of the competitor’s website but was almost at par with the other competitor. There was definitely some scope for improvement but not a very significant one.
With the above analysis, we were sure that even if we make some improvements on the website, we may be able to improve some conversions, but scale would still be a challenge. Hence, we decided to do a deeper dive on the source of traffic for the client and his competitors.
Source of Traffic
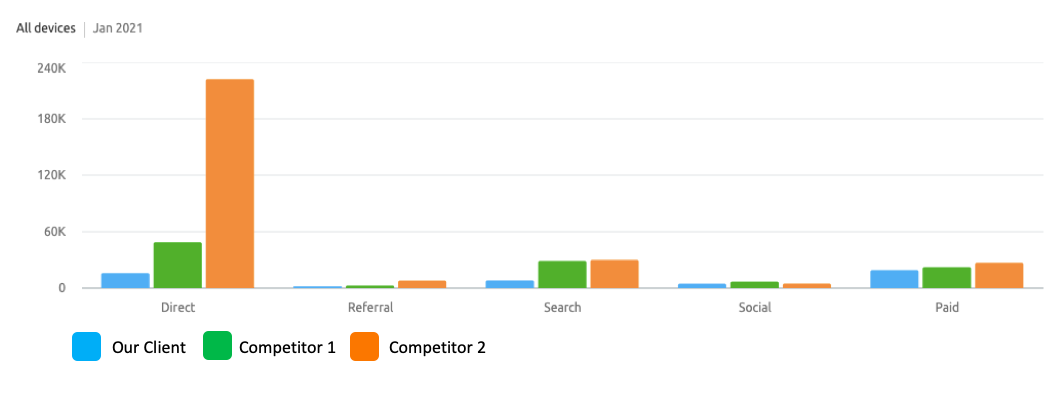

We observed that though the traffic for our client was lower across all channels with respect to the competition, but the biggest different was in Direct and Organic Search traffic.
It means there were not enough users searching for the brand or visiting the brand’s website directly. Moreover, since the traffic from Direct or Organic Search was low (which generally has better conversion rates across all other marketing channels because of purchase intent), we were missing out on a large sales opportunity. Just driving traffic from performance marketing activities at the bottom of the funnel was resulting in poor conversions and limited sales.
With this insight, we decided to look at the breakup of brand vs. non-brand traffic for search traffic for our client and his competitors.
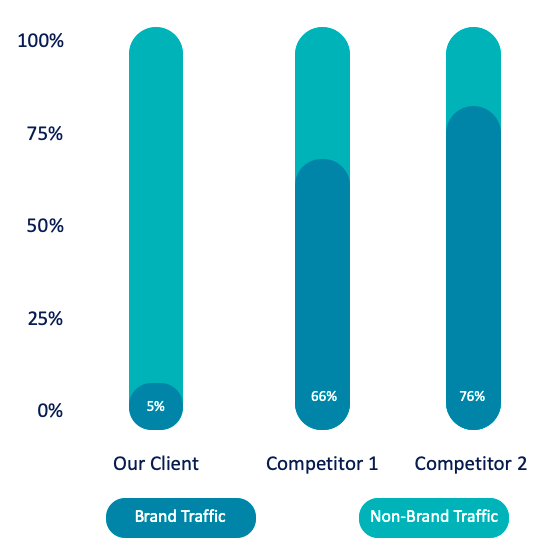

The non-brand traffic for our client was 95% which meant that there were very few people searching for the brand in Google.
On the contrary, both the competitors had much higher brand traffic, which shows that they had a much better brand pull and influence to drive sales on their website.
Brand Traffic Trend
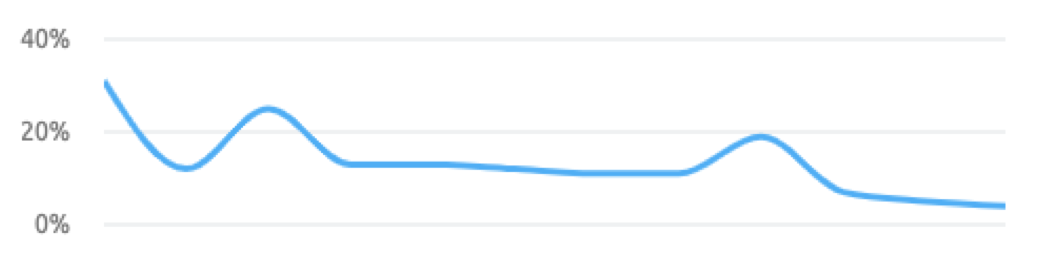

Moreover, we found that the brand traffic also showed a declining trend for our client over the last 6 months.
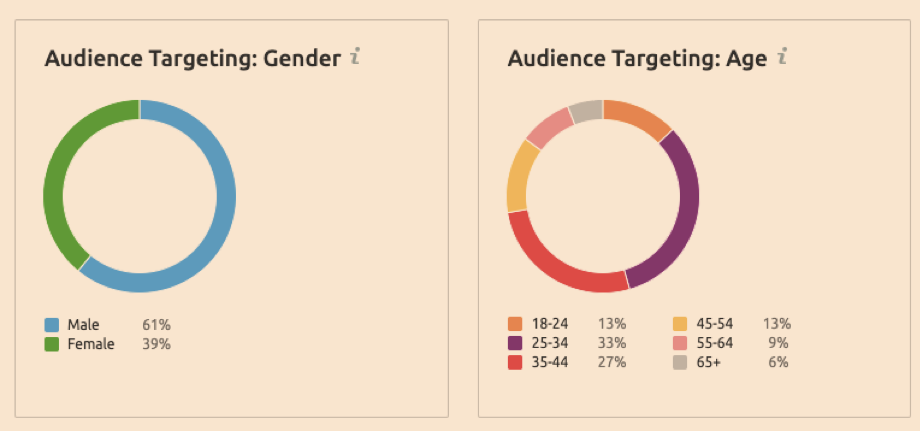
Audience Targeting
We further compared the client’s audience targeting in terms of Age and Gender with his closest competitor and found some interesting facts.


Our Client

Competitor
Though the age group targeting was almost the same, but our client was targeting more Male audience and less Female audience, which was an issue.
Being a women’s brand, the core target audience should have been Female and that is what the competitor was doing right to drive relevant traffic to his website.
After doing a thorough audit of the website traffic, we did an analysis of the user sentiments and share of voice to understand how user’s look at our client’s brand as against the competition.
We decided to do this across 3 competitors this time to get a larger perspective.
Relative Share of Voice
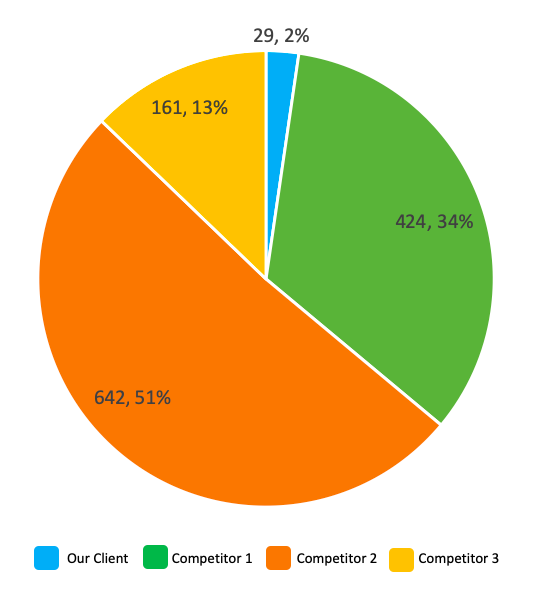

In a month, our client was mentioned only 29 times amongst 1,256 total mentions for all brands put together, and thus had the least share of voice of just 2% as compared to its competitors. That means, that only 2% people were talking about the brand which indicates a poor brand visibility and recall amongst the target audience.
Overall Sentiment Analysis
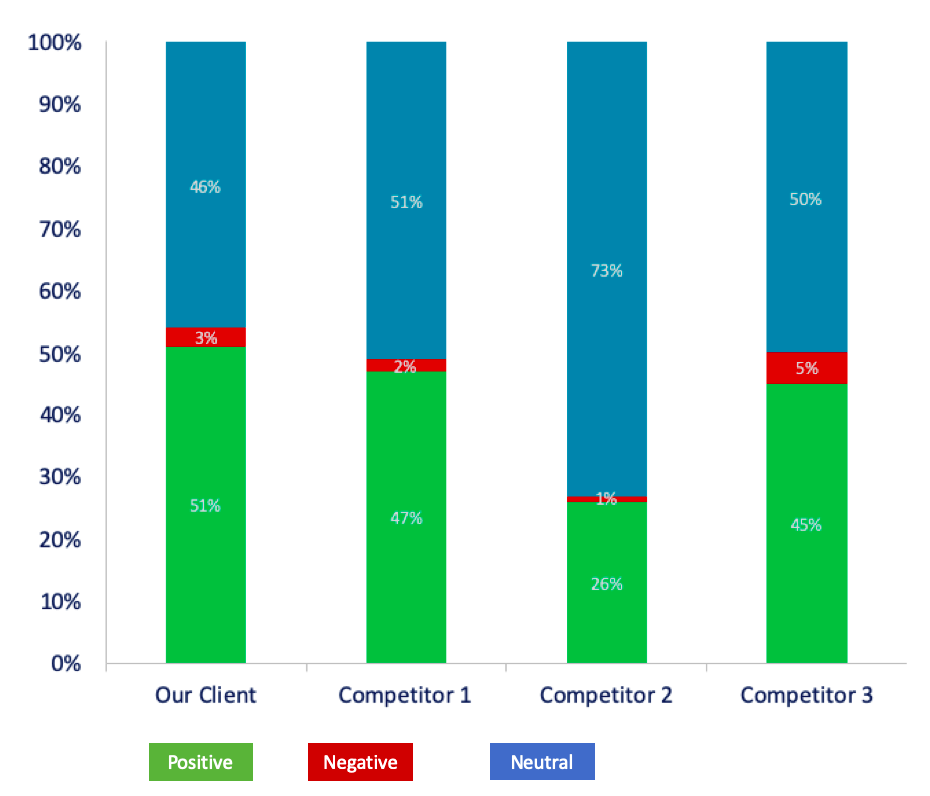

During the same month, we further analyzed what consumers spoke about the respective brands to measure their sentiments on a scale of 100. It was good to see that users spoke positively about our client’s brand and did not have many negative conversations around the brand.
Thus, it was clear that the need of the hour for our client was not to change the user’s sentiments about their brand, but to reach out and influence more and more people through their brand marketing activities.
Customers Breakup
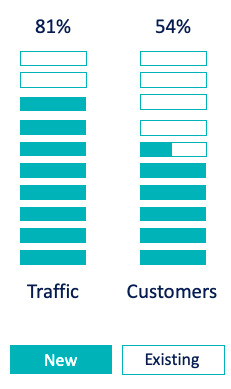

We further analyzed the data for last 12 months and noticed that though more than 80% of website traffic was new users, but the percentage of new customers buying was just 54%.
Thus, a large part of the paying customers were repeat customers only and the total base itself was quite limited in size.
Proposed Strategy
Basis our analysis, we advised the client to do the following:
- Not to increase spends in performance marketing
- Focus on brand advertising and increase top of the funnel reach
- Use engaging content including brand video, influencers, etc. to create brand aspiration.
- Amplify content across multiple digital assets including Instagram, Facebook, YouTube and Programmatic.
- Re-target the users who engage with the above content with sales led performance marketing ads.
After advising the client on the above basis our thorough competitive intelligence report, we laid out a complete digital strategy with specific budgets, media mix, content mix and amplification plan for the next 12 months.
Results
Within the first 3 months of implementation, we achieved the following results:
- 20% increase in share of voice
- 7% increase in Ecommerce Conversion Rate
- 17% increase in new customer acquisition